If you have a long running application, there is a high chance that sooner or later, it’s going to misbehave. Load changes, usage patterns increase, or perhaps just running for long periods of time is something your application doesn’t deal well with. In times like this you need to monitor your application so you can get on with reproducing - and ultimately solving - the problem.
Johan Tibell’s EKG package is one answer. EKG provides you with a HTTP server that runs alongside your application, allowing you to view real time statistics. Simply by enabling EKG, which is only a handful of lines in the IO monad, you get access to a lot of juicy GHC details.
Reusing the example of helping Santa from the postgresql-simple article, lets add some monitoring:
main :: IO ()
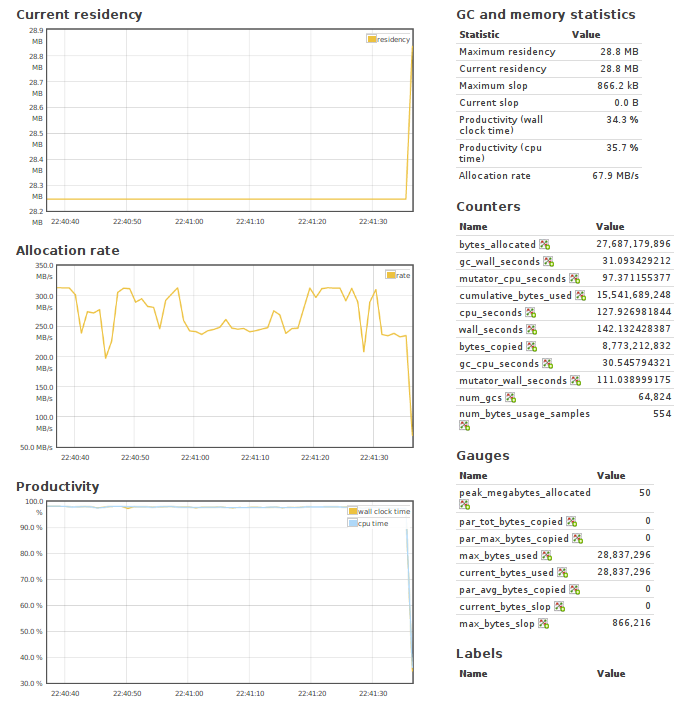
main = forkServer "localhost" 8000 >> santaNotifierWell, that wasn’t hard! Now if we connect to http://localhost:8000/ while the server is running, we’re present with something a little like this:
The default dashboard shows you a graph of resident memory usage, allocation rate and productivity, but you can make any statistic you want become a graph by simply clicking on the little graph icons.
But EKG doesn’t stop there - it also provides you with the ability to create your own counters, gauges, and labels. This means that you now have the ability to track application specific metrics, and have them graphed in real time! Perhaps we want to have a counter for every time we notify Santa:
main :: IO ()
main = do
  ekg <- forkServer "localhost" 8000
  getCounter "notifications" ekg >>= santaNotifier

santaNotifier c counter = listen >> loop
  where
    listen = query c "LISTEN presents"
    loop = forever $
      getNotification c >>= notifySanta . notificationData >> inc counter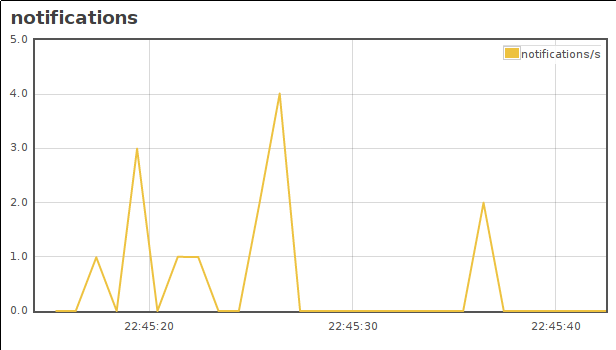
Your also not constrained to the HTML display that EKG provides you with - all of the URLs endpoints take the Accept header, allowing you to vary the content type, with choices of JSON and plain text currently.
EKG takes very little time to setup, but the gains are enormous, especially once you have started graphing your own metrics. Johan has blogged about EKG before, so be sure to check that out too.
EKG isn’t the only solution, of course - you still have the option of tools like statsd or rolling your own custom monitoring code. But sometimes you just need some numbers now. STAT!
You can contact me via email at ollie@ocharles.org.uk or tweet to me @acid2. I share almost all of my work at GitHub. This post is licensed under a Creative Commons Attribution-NonCommercial-NoDerivs 3.0 Unported License.


